Columns AI Lifetime Deal
The Columns AI lifetime deal is $79 one-time on StackSocial (listed as 91% off a $900 value), backed by a 60-day money-back guarantee.
- Type Lifetime
- Verdict Buy
- Status Active
- Updated Jun 20, 2026
- Confidence Medium
- Score 7/10
Verdict: Buy
At $79 one-time with a 60-day refund window, Columns AI is a low-risk pickup for teams turning simple data into polished visuals, but its weak analytics, no offline mode, and large-dataset lag keep it short of a heavy-use tool.
On this page7 sections
What is Columns AI?
Columns AI is a data storytelling tool that turns spreadsheet and database data into charts, slides, and shareable visual narratives. The Columns AI lifetime deal is $79 one-time on StackSocial (listed as 91% off a $900 value), backed by a 60-day money-back guarantee.
The Columns AI lifetime deal sells for $79 one-time on StackSocial, listed as 91% off a stated $900 value, and it replaces a recurring subscription with a single payment. Columns AI connects to Notion, Airtable, Google Sheets, SQL, and CSV files, then turns that structured data into charts, slides, and shareable visual stories using Canva-like design tools. The catch shows up quickly: independent reviews report that performance degrades on large datasets, there is no offline mode, and the tool lacks the statistical depth of full BI suites. If your work involves predictive analytics, custom R or Python, or heavy data volumes, Power BI at $10 to $20 per user per month or Tableau will serve you far better, even though they cost more over time. For teams that mainly convert simple campaign, survey, or report data into clean executive visuals, the $79 one-time price and 60-day money-back guarantee make this a low-risk pickup. Just go in understanding it is a presentation and storytelling layer, not an analytics engine, and that future major updates are not clearly guaranteed under the lifetime terms.
Pros & Cons
Pros
- A $79 one-time payment replaces an ongoing subscription, and even one or two years of use returns positive value against the stated $900 figure.
- Native integrations with Notion, Airtable, Google Sheets, and SQL make it easy to pull live data without manual exports or copy-paste work.
- Canva-like design tools and one-click charts let non-technical users produce branded, presentation-ready visuals quickly.
- Real-time sync keeps published charts and embeds updated as the source data changes, which is useful for recurring reports.
- A 60-day money-back guarantee gives a genuine safety net to test the tool against your own workflows before committing.
Cons
- Performance slows noticeably on large datasets, so data-heavy teams will hit friction during visualization and chart generation.
- There is no offline access or editing, which makes the tool unusable for field work or unreliable-connectivity environments.
- It lacks advanced analytics, predictive modeling, and statistical testing, so it cannot replace Tableau, Power BI, or Julius AI for serious analysis.
- Community and support resources are sparse, leaving users with edge cases or bugs short on troubleshooting help.
- Future major updates are not clearly guaranteed under the lifetime deal, and the company is an early-stage startup with no public commitment to long-term deal support.
What It Does
- Connects Notion, Airtable, Google Sheets, SQL, and CSV
- Auto-generates charts, graphs, and presentation slides
- Offers Canva-like design tools for custom branding
- Syncs visuals in real time with source data
- Shares via links, Slack, and Notion embeds
- Controls access with fine-grained sharing permissions
Who It's For
- Marketing and sales teams building data-driven presentations
- Executives who need quick visual summaries from reports
- Small to mid-market teams reporting survey or campaign results
- Non-technical users who want charts without spreadsheets
Pricing Comparison
| Plan | Price | Type |
|---|---|---|
| Columns AI Lifetime (StackSocial) | $79 one-time | ⭐ Best Value |
| Columns AI Subscription | Check pricing > | Subscription |
| Power BI Pro | $10-20/user/month | Subscription |
| Tableau Creator | $70-100/user/month | Subscription |
| Julius AI | $40-80/month (est.) | Subscription |
| RAWGraphs | Free (open-source) | Free |
Feature Comparison
| Feature | Columns AI | Tableau | Power BI |
|---|---|---|---|
| Lifetime deal pricing | ✅ | ❌ | ❌ |
| Native Notion / Airtable integration | ✅ | ❌ | ❌ |
| Canva-like design and branding tools | ✅ | ❌ | ❌ |
| One-click auto charts | ✅ | ✅ | ✅ |
| Real-time data sync | ✅ | ✅ | ✅ |
| Predictive analytics / forecasting | ❌ | ✅ | ✅ |
| Advanced statistical analysis | ❌ | ✅ | ✅ |
| Custom R / Python analytics | ❌ | ✅ | ✅ |
| Offline desktop editing | ❌ | ✅ | ✅ |
| Geographic / map visualizations | ❌ | ✅ | ✅ |
| Handles large datasets without lag | ❌ | ✅ | ✅ |
Limitations
- Columns AI degrades in performance on large datasets, with users reporting delays in visualization and chart generation that slow down workflows (per Research.com review).
- The tool requires an active internet connection at all times, with no offline access or editing, which rules out field teams and anyone working in low-connectivity areas (per Research.com review).
- It lacks deep statistical analysis, predictive modeling, and complex business intelligence capabilities, making it suitable for simple data storytelling rather than serious analytical work (per Research.com review).
- Geographic and map visualization functionality is weak compared with dedicated mapping tools or full BI suites like Tableau and Power BI (per Tools for Humans listing).
- Some users report a moderate-to-steep learning curve once they move beyond default templates into full customization features (per Tools for Humans listing).
- Community and support resources are thin, so users hitting unusual bugs or edge cases may struggle to find solutions or timely help (per Tools for Humans and Research.com).
- The StackSocial lifetime deal does not clearly guarantee future major version updates, so buyers may be locked to the current feature set in perpetuity (per StackSocial deal page terms).
- Marketing mentions 'unlimited' embeds and shares, but no explicit fair-use policy was found, so heavy commercial users may hit undocumented throttling or limits (per research findings).
What's Missing vs Competitors
- Predictive analytics and forecasting, which both Tableau and Power BI include for trend projection and what-if modeling.
- Custom R and Python analytics scripting, available in Tableau and Power BI for advanced statistical testing and data transformation.
- Offline desktop editing, offered by Tableau Desktop and Power BI Desktop, while Columns AI is cloud-only and needs constant connectivity.
- Strong geographic and map visualizations, a standard feature in Tableau and Power BI that Columns AI handles only weakly.
- Python-powered data analysis and pipeline automation, which Julius AI provides for code-free statistical work that Columns AI cannot match.
Who Should Skip This Deal
- Data scientists and analysts who need statistical modeling and R/Python scripting should choose Tableau or Power BI instead.
- Teams that routinely process large datasets should skip this and use Power BI, since Columns AI lags on heavy data volumes.
- Anyone needing offline access or field reporting should look elsewhere, because Columns AI is cloud-only with no offline mode.
- Budget users who only need free charting can use RAWGraphs, an open-source tool, rather than paying for a lifetime license.
Frequently Asked Questions
- For the right use case, the $79 one-time lifetime deal on StackSocial is reasonable value, especially against the listed $900 figure and the recurring subscription it replaces. It is worth it if your main job is turning simple datasets from Notion, Airtable, Sheets, or CSV into polished charts, slides, and shareable visual stories for executives or clients. It is not worth it if you need statistical analysis, predictive modeling, offline editing, or smooth handling of large datasets, since independent reviews flag clear weaknesses in all of those areas. The 60-day money-back guarantee lowers the risk meaningfully, so you can test it against your own reporting workflow and request a refund if it falls short of what you need.
- The Columns AI lifetime deal on StackSocial is covered by a 60-day money-back guarantee, according to the Research.com review of the product. Standard StackSocial refund terms apply, which generally means refunds are processed within the stated window and may require that the account meets the platform's usage conditions. Sixty days is a competitive window and gives you enough time to connect your real data sources, build a few reports, and judge whether performance and features fit your needs. Keep in mind that the guarantee protects you during the early evaluation period, not against longer-term risks such as the company pivoting, being acquired, or pausing development. If long-term durability matters to you, factor that startup risk into your decision before the refund window closes.
- Columns AI and Power BI serve different jobs. Power BI, at roughly $10 to $20 per user per month on the Pro tier, is a full business intelligence platform with predictive analytics, advanced statistical analysis, custom R and Python scripting, strong map visualizations, offline desktop editing, and the ability to handle large datasets without lag. Columns AI offers none of those at the same depth. What Columns AI does better is speed and simplicity for non-technical users: native Notion and Airtable integration, Canva-like design tools, and one-click charts that produce attractive, shareable visuals fast. If you need real analytics or work with heavy data, choose Power BI. If you mainly need clean executive-facing visuals from simple data and prefer a one-time payment, Columns AI fits, though Power BI wins on raw capability.
- The most consistent limitations across reviews are performance degradation on large datasets and the lack of any offline mode, since the tool requires a constant internet connection. It also lacks advanced analytics, predictive modeling, and statistical testing, so it is built for simple data storytelling rather than deep analysis. Geographic and map visualizations are weak compared with Tableau and Power BI, and several users report a moderate-to-steep learning curve once they move past default templates. Community and support resources are thin, which makes troubleshooting edge cases harder. On the deal side, the StackSocial lifetime terms do not clearly guarantee future major version updates, and the 'unlimited' embed and share claims lack a published fair-use policy, so heavy commercial users may encounter undocumented limits.
- Data scientists and analysts who rely on statistical modeling, predictive analytics, or custom R and Python scripting should not buy Columns AI; Tableau or Power BI are the better fit for that work. Teams that regularly process large datasets should also skip it, because the tool lags on heavy data volumes, and Power BI handles scale far more reliably. Anyone who needs offline access or field reporting should avoid it entirely, since it is cloud-only with no offline editing. Finally, budget-conscious users who only need basic charting can use RAWGraphs, a free open-source option, instead of paying for a lifetime license. Columns AI is best reserved for marketing, sales, and executive teams converting simple data into polished visuals, not for analytical or large-scale data work.
Is Columns AI worth the money?
What is the refund policy for Columns AI?
How does Columns AI compare to Power BI?
What are the main limitations of Columns AI?
Who should NOT buy Columns AI?
Sources
Related tools & guides
Alternatives to Columns AI
Other active deals in AI Analytics
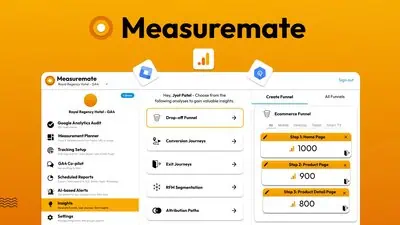
MeasureMate is an AI-powered Google Analytics 4 assistant that automates GA4 audits, GTM tag deployment, BigQu...

Fox Signals is an AI trading signal app that scans crypto and stock markets and pushes real-time buy and sell ...
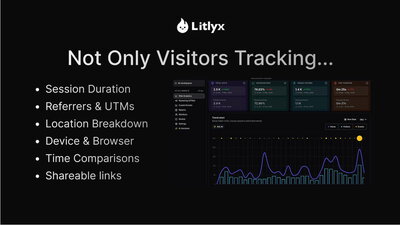
Litlyx is a privacy-first, cookie-free web analytics platform with GDPR compliance, AI-generated reports, and ...
Equitest is an AI business valuation platform that generates 30+ page reports using DCF, VC Method, and multip...
Comments
Loading comments...